You’ve recently launched a social media marketing strategy for your clients. But how do you know if it’s working? How do you measure success on social media and what does success look like to your clients?
This is why you need to have a clear idea of the social media metrics you should be reporting on.
Key metrics will help your clients understand the returns on their social media investment. In your case, they will give a clear indicator of the difference you’re making for your clients. So it helps prove your value to them.
The ideal social media metrics or key performance indicators (KPIs) may vary depending on your clients’ goals.
For instance, if the goal is to grow revenue, you might be looking at conversion rate and cost per acquisition. And if you want to increase brand awareness in general, you’ll be looking at metrics like reach and follower growth rate.
But regardless of the specific goals, there are a few key metrics that will give your clients the big picture and satisfaction. Let’s take a look at the social media metrics that you should report in 2024:
1: Profile Growth
How much has their social presence grown and how quickly? Were there any spikes in follower growth after a certain post or during a certain campaign? Did you see sudden drops in follower count after you posted something?
Measuring your profile growth helps you figure this out with metrics like follower growth rate and unfollow rate. A sudden spike in unfollow rate could be an indicator of a mistake on your part. Perhaps your messaging was off or one of your recent campaigns didn’t sit well with your target audience.
But if you see an increase in follower growth, this could be an indicator that what you’re doing is working. And so, it gives you an idea of what’s working and what isn’t. Having this knowledge allows you to quickly fix things if needed or repeat processes that work.
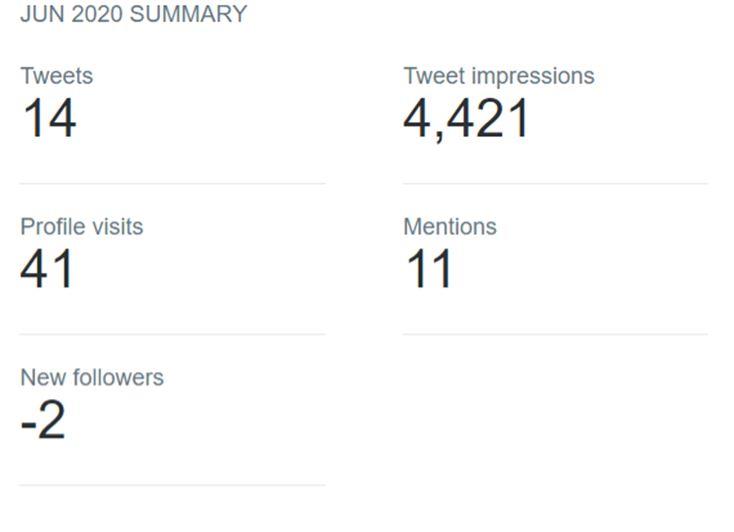
Most of the native analytics tools on different social media platforms can provide you with this information. On Twitter, for example, you get a monthly breakdown of your performance metrics, which includes new follower count. In case you’ve lost followers, the number will have a “minus.”
2: Reach
Believe it or not, reach is an even more critical performance metric than impressions.
That is because impressions only give you an idea of how many times your post was viewed in total. So it doesn’t factor in how many times the same person viewed the post.
But reach narrows down the number to unique views. That means you can track how many unique individuals saw your post.
So reach paints an even more accurate picture of brand awareness and post visibility. This makes it a critical social media metric to report on in 2024.
Keep in mind that many native social media analytics tools will only report on impressions. This calls a robust social media analytics tool that can help you measure the reach data for each post.
3: Post Engagement
How are people responding to your posts?
It is crucial to understand what resonates with your audience. You can then use this to inform your social media content strategy and your overall approach at engaging your audience.
For this, keep track of the engagement on each of your posts. Most platforms have native analytics tools that provide you with this data.
You can also calculate your engagement rate to benchmark your performance over time and rank it against competitors. This will involve measuring the likes, comments, and shares and comparing them against your following size.
Compare the changes by timing, topic, content format, and so on. This will help you figure out what’s working and what isn’t. You can then adapt your social media strategy according to your audience’s tastes.
Let’s say you find that people are engaging more with posts that you publish between 12 and 2 PM on Sundays. You could make adjustments to your publishing schedule and target that time slot.
The native analytics tool on Instagram shows you when your audience is the most active. You can use these insights as a foundation to create a rough publishing schedule. Then test the schedule to see what’s working and what isn’t.
4: Stories Engagement
The way people engage with your Instagram and/or Facebook Stories tell you a lot about your relationship with them.
Use the insights to find out how well you manage to hold their attention and what resonates with them. Keep a close eye on what they re-watch and what they skip. This will help you figure out what kind of Stories people want to see from you.
Perhaps they tend to re-watch Stories about discounts and promotions. But they skip the Stories where you give them a behind-the-scenes view of the brand. So, you might want to create more attractive Stories that promote your latest discounts and offers.
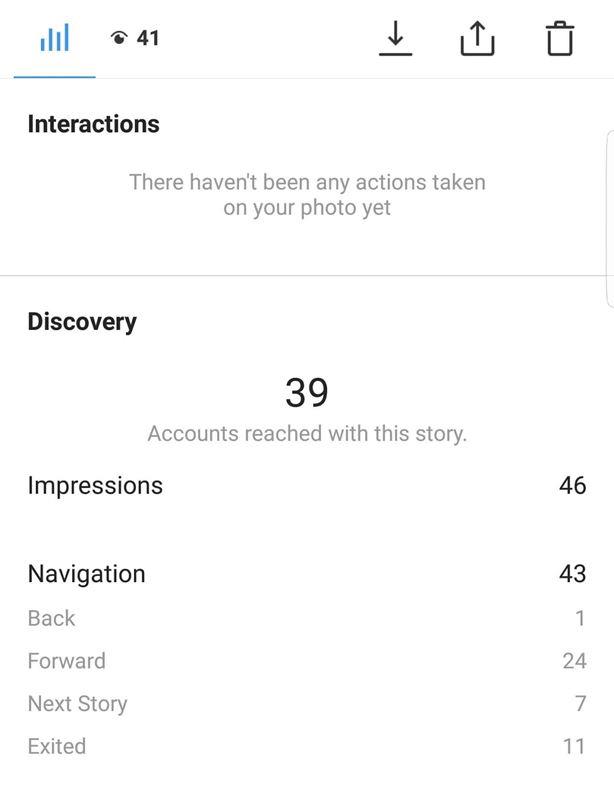
The native analytics tools typically give you some idea of how your Stories are performing. But you might need to invest in a more robust analytics tool for more comprehensive insights. Try to find out how people are dropping off, how many of them completed each Story, and so on.
5: Share of Voice
How much buzz is the brand generating compared to their top competitors?
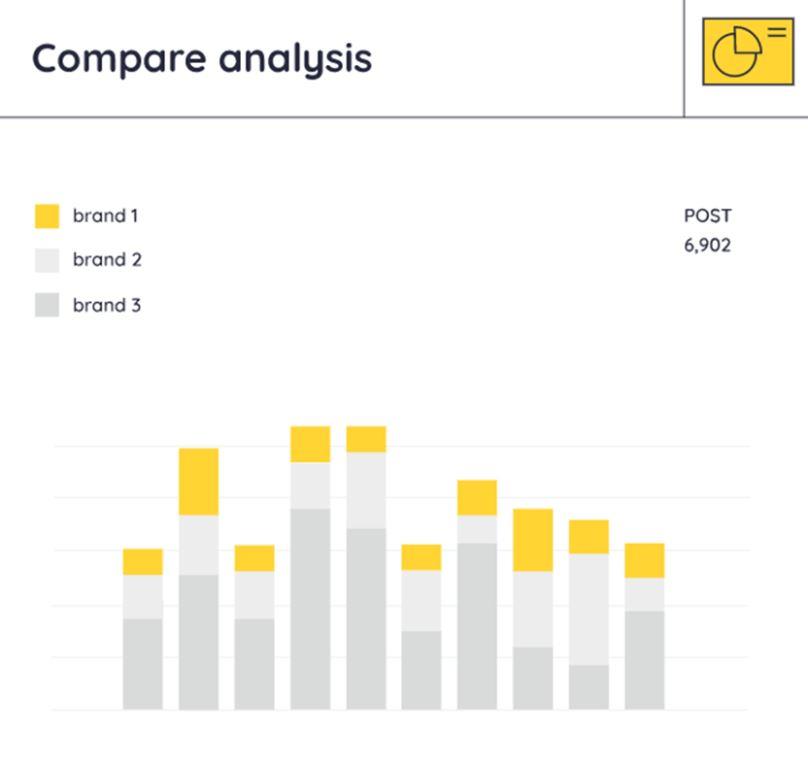
While it helps to track total brand mentions, it’s even better to measure how those numbers hold up against the competition. This helps you get a clear idea of the brand’s popularity in the industry.
Are your efforts inspiring more conversations compared to other brands in the industry? If not, it might be a good idea to see what the competition is doing differently. Then find out how you can implement or surpass those ideas for your client’s social media strategy.
Use this to figure out what the competition is doing right or wrong. Then implement those insights into your client’s social media engagement strategy.
Be sure to measure sentiment too, since volume alone doesn’t paint a complete picture of the conversations happening around the brand. Are most of the conversations giving a nod to the brand? Or are you seeing lots of negative comments and complaints about the brand?
For instance, the Keyhole Social Media Account Analytics tool gives you a detailed look into where your client stands against the competition. Besides comparing their following size and engagement, the tool also gives you a clear picture of their share of voice, as well as sentiment analysis. As a result, you will get a clear picture of who’s leading the conversation and why.
6: Traffic
Besides search and referral, social media is a great way to send traffic to your website. And you can do so by sharing links to your content, product pages, and so on. So keeping track of social media referral traffic helps you get a 360-degree view of your performance.
Which posts are driving the most traffic? What do they have in common? Are people more likely to visit your blog post pages from Instagram Stories or from Facebook?
Get the data for all of these and figure out a way to boost your social media referral traffic.
Don’t forget to get an even more complete picture by tracking bounce rate as well. How many people bounced after clicking on your CTA?
A shockingly high bounce rate could be an indicator of some disconnect between your CTA, landing page, and messaging. Spend time in creating a clear and compelling call to action.
8: Sales/Conversions
How does your social media effort directly translate to revenue?
This is a critical social media metric to measure across industries. Also, one that your clients will be eager to know.
How much of the traffic coming from social media converted into signups or purchases? Which types of posts were the most successful at driving those conversions? And which platforms were the most effective?
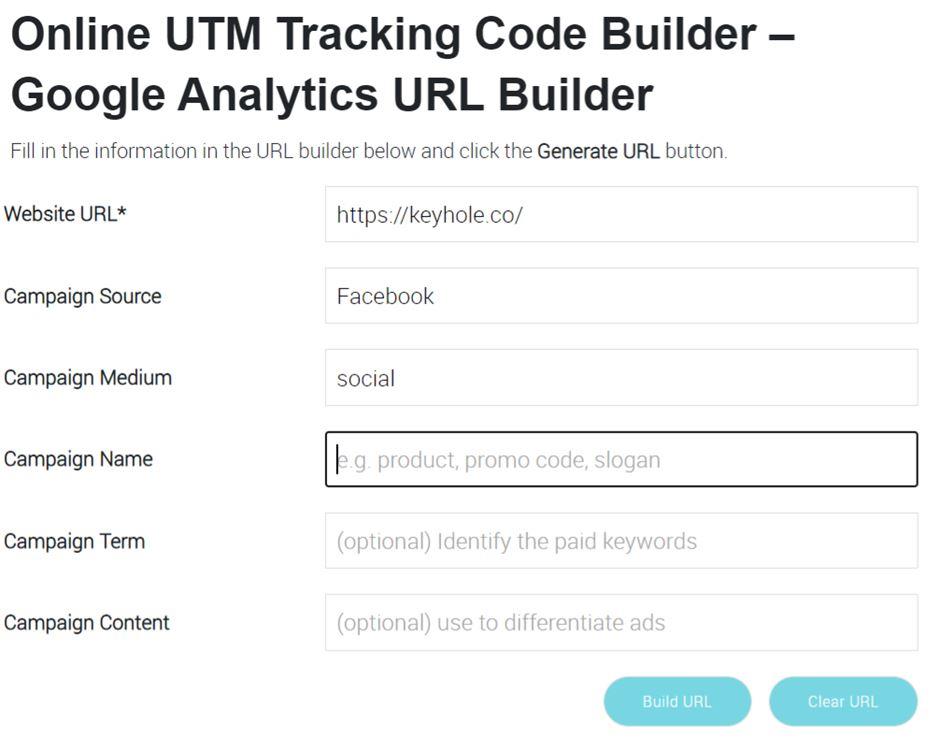
Make the most of UTM parameters to track platform-specific conversions and post-specific performance. Tag each link with unique parameters to tell you where the traffic is coming from and which posts were responsible.
With the right UTM parameters, you can even tell which CTA brought on those conversions. Use tools like UTM.io to create customized tracking codes for your social media posts.
In the case of social media platforms – such as Instagram – that support in-platform checkouts, you should also look into sales metrics. This will tell you how many people bought something directly on the platform after discovering it through your posts.
9: Saves (for Instagram)
For brands on Instagram, saves are also a useful metric to see how much interest people have in the brand’s content.
When a user “saves” an Instagram post, they can store it to their collection to view again later. This suggests that people are highly interested in the content and will be engaging with it later. And this plays a role in the overall Instagram SEO.
Plus, you get an idea of which types of posts people are most likely to save. So you can amp up your Instagram content strategy based on those insights. For instance, if people tend to save your short “how to” videos more than anything else, then consider creating more of them.
With an Instagram business account, you can track the amount of saves under the insights for each post. Note that you can only do this using the mobile app.

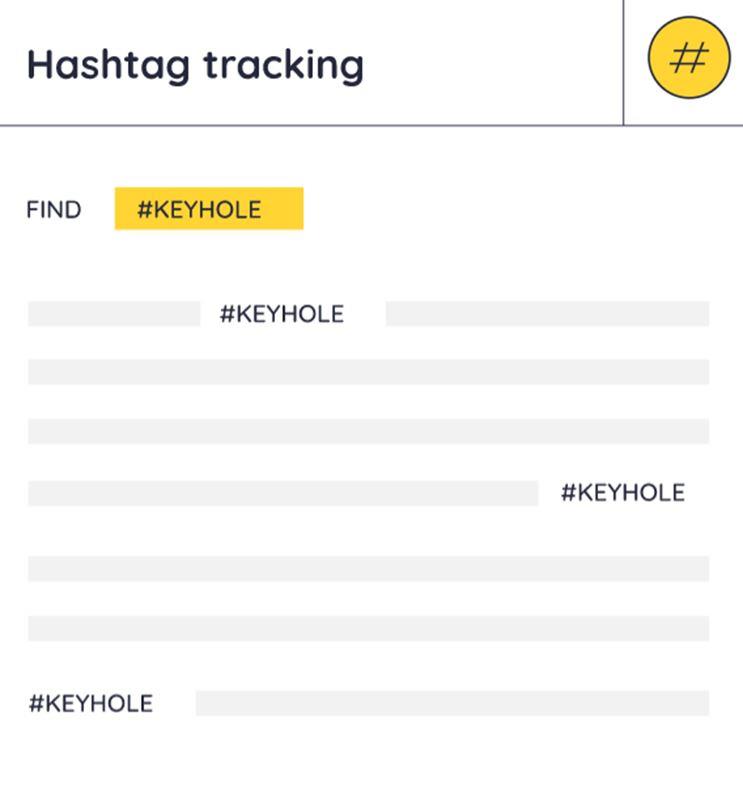
10: Hashtag Engagement
To get a complete picture of campaign performance, make sure you also track your hashtag engagement. This will help you figure out how people are responding to your campaigns.
Are people using your hashtag at all? What’s the sentiment surrounding the hashtag? Which types of posts are they using the hashtag with?
Get a detailed look at your hashtag performance using a hashtag analytics tool. These tools aggregate all your hashtag performance metrics across social media platforms so you can view them in one place.
Take Your Reports to the Next Level
For agencies, building comprehensive reports help establish your value to the clients. It gives them a clear idea of how much you’re contributing and what kind of difference you’re making.
Make the most of these social media metrics to build robust reports in 2024 to wow and retain your clients.
Jacqueline Zote is a digital marketing and entertainment writer who makes regular contributions to Keyhole and Soda.com. Her interests range from pop culture and mythology to social activism. When she’s not writing, she goes on food adventures and binges on crime drama. Her short fiction has been published by HarperCollins Publishers and Zubaan Books.